The Cleveland Cavaliers are big underdogs in the NBA Finals. Ahead of Thursday’s Game 1, the Golden State Warriors are favored by 12 points over the visiting Cavaliers. According to ESPN Stats & Information data, that ties Game 1 of the 2001 Finals (with the Los Angeles Lakers favored over the Philadelphia 76ers) as the largest point spread in a Finals game since at least 1991.
So just how lopsided is this fourth consecutive Finals meeting between Cleveland and Golden State? Could it be the biggest mismatch in modern Finals history? Let’s take a look.
Cavaliers atypically poor in regular season for a Finals team
On a surface level, the eight-win gap between the Warriors and Cavaliers in the regular-season standings is nothing unusual for the NBA Finals. The average matchup since the playoffs expanded to 16 teams in 1984 has the two teams separated by 7.1 wins, and Golden State has had much bigger edges in wins during each of the past three Finals meetings between the teams. The Warriors won 16 more games than the Cavs in both 2015-16 and 2016-17, and 14 more in 2014-15.
Complete coverage | Expert picks | Bracket
• Cavs-Warriors IV was inevitable … right?
• How the Cavs can defy odds, pull off upset
• Playoff MVPs: LeBron, Draymond and more
• Finals Forecast: Who wins, who takes MVP?
• 5-on-5: Answering the big Finals questions
• Cavs-Warriors IV: A rivalry for the ages
• Why Cavs-Warriors deserves appreciation
• Why Warriors destroy when Curry gets hot
• Game 7 win a defining moment for LeBron
• The scariest three minutes in the NBA
• 13 moments that help shape LeBron’s story
• NBA offseason guides for eliminated teams
• Tickets on Vivid Seats
However, looking at records understates the difference between the two teams in terms of dominance. Due in large part to their success in close games, the Cavaliers’ plus-0.9 point differential in the regular season was the worst for a team that reached the Finals since the 1980-81 Houston Rockets and third lowest among that group since the ABA-NBA merger.
Golden State’s point differential was 5.0 points per game better than Cleveland’s during the regular season, the fifth-largest gap since 1984. Three of the top five mismatches from this standpoint have been Cavaliers-Warriors matchups, and four of the seven biggest mismatches have involved these two. That includes 2016, when Cleveland beat Golden State. That year, the Cavaliers’ strong run through the conference playoffs portended a more competitive series than regular-season results suggested. But that’s not the case this year.
Cavaliers not much better in the playoffs
Having needed the maximum seven games to win two of their three series, and having been outscored by the Indiana Pacers in the opening round, Cleveland has a net rating of just 1.2 points per 100 possessions in the playoffs. If that sounds low, it should. It’s the fifth lowest for any team reaching the Finals since 1984 and the worst since the first round went to seven games in 2003.
The Cavaliers improve a little when we account for the regular-season net ratings of the opponents they faced — the fifth-seeded Pacers, the top-seeded Toronto Raptors and No. 2-seeded Boston Celtics — but only to sixth-lowest opponent-adjusted net rating since 1984.
That’s very different from the past three Finals. The Cavaliers turned it on and dominated East foes in 2016 and 2017, posting the fourth- and fifth-best adjusted ratings by finalists since 1984, behind three of the most dominant playoff teams in modern NBA history: the 15-1 2001 Lakers, the 1996 Chicago Bulls and last year’s Warriors. Cleveland wasn’t quite as strong in 2015 en route to the Finals but still posted a slightly better adjusted net rating than Golden State that year.
This time around, the difference between the Warriors’ opponent-adjusted net rating in the playoffs (plus-15.1, good for seventh since 1984) and the Cavaliers’ is one of the biggest for any Finals matchup in that span.
Certainly, it’s clear from regular-season point differential and adjusted net rating in the playoffs to date that this year’s Finals is in contention for the most lopsided since 1984. The 2001 and 2002 Finals, when the East was at a nadir relative to the West, look like the other contenders for most lopsided.
The 2000-01 Lakers are the all-time “light switch” team, having followed up a 56-26 regular season with an undefeated 11-0 run to the Finals against extraordinarily difficult competition. (In fact, the plus-6.9 regular-season net rating of the Lakers’ opponents is the highest for any finalist since 1984.) Meanwhile, like this year’s Cavaliers, the 76ers needed seven games to win two of their three series. So despite the Lakers and 76ers having identical regular-season records, it’s understandable why the Lakers were favored by as much to start the series as the Warriors are now.
The Lakers returned to the Finals in more conventional fashion the following season, winning six more games than the East champion New Jersey Nets with a point differential 3.0 points per game better during the regular season. The Lakers weren’t as dominant in the 2002 playoffs, coming from behind to beat the Sacramento Kings on the road in Game 7 of the Western Conference finals (much like this year’s Warriors), but the Nets posted the lowest opponent-adjusted net rating for any finalist since 1984.
Ultimately, the presence of LeBron James might make it difficult to accept the Cavaliers as the biggest mismatch, even with the weakness of his supporting cast. Though Philadelphia’s Allen Iverson won MVP in 2000-01 and New Jersey’s Jason Kidd was runner-up the following season, neither came close to matching LeBron’s dominance or track record in the playoffs. Still, Cleveland has needed everything James can offer to outlast the Pacers and Celtics, suggesting trouble ahead now that the competition will get much more formidable.
How can the Cavaliers defy the odds?
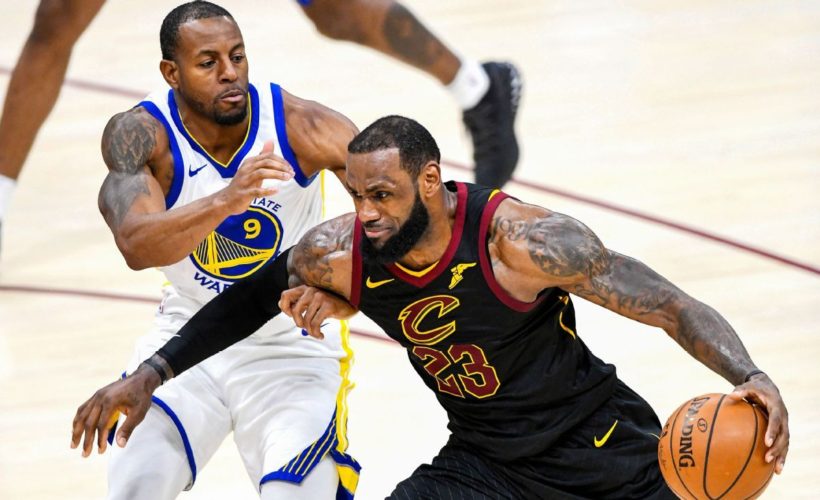
So how can Cleveland overcome long odds, much as in coming back from a 3-1 deficit during the 2016 Finals? Andre Iguodala‘s absence could help even things up. Iguodala’s ability to defend James and space the court at the other end has been an important factor in the past three matchups, most notably in winning Finals MVP in 2015.
According to Second Spectrum tracking, the Cavaliers posted a 130 offensive rating on possessions during last year’s Finals when Kevin Durant was James’ primary matchup. That dropped to 116 points per 100 possessions with Iguodala defending James.
James also was much more effective individually when defended by Durant rather than Iguodala. (No other Warriors player matched up with James for more than 35 possessions during the five-game series.) James’ scoring dropped from 42 points per 100 possessions against Durant to 31 when matched with Iguodala, and James’ effective field goal percentage dropped from 64.7 percent to 52.9 percent.
As a result, Cleveland outscored Golden State by 13.6 points per 100 possessions in last year’s Finals with James on the court and Iguodala on the bench, per NBA Advanced Stats. With both players on the court, the Warriors held a 13.2-point edge per 100 possessions, flipping the outcome.
Certainly, the Cavaliers aren’t as good now as they were a year ago. However, if Iguodala remains sidelined by a lateral leg contusion — he recently got a second opinion on the injury, according to ESPN’s Chris Haynes — it becomes easier for Cleveland to adopt a strategy similar to the 2015 Finals of slowing the game down by playing through James in the post and surrounding him with strong defenders.
We just saw the Cavaliers use that kind of formula to win Game 7 of the Eastern Conference finals, with Jeff Green replacing the injured Kevin Love.
With Iguodala sidelined, there’s hope for Cleveland. Still, by most any measure, on paper this is one of the most lopsided Finals matchups in recent memory and perhaps even the biggest mismatch.
Source:ESPN